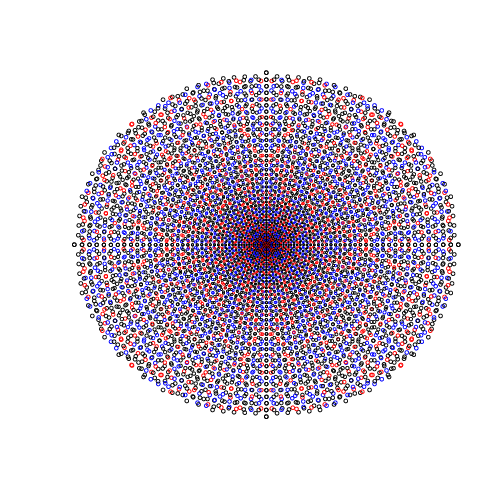
Pythagorean triples plot
Talking with David Earn and Ben Bolker about simple, mathy programs that make nice pictures (for pedagogical reasons).
David suggested plotting Pythagorean triples. He said to reduce them to rationals, but I couldn’t figure out a good way to do that (the natural way just produces points on a circle), so I stuck with the integers.
This code plots (a, b) from Pythagorean triples \(a^2+b^2=c^2\), for \(c\leq50\). The circles get bigger at rate \(\sqrt{c}\) (chosen arbitrarily and kind of looks nice). The box goes from (-50, 50) on each axis. It has some nice patterns.

